


The detection of contours and defects in optical plates (such as optical glass, acrylic plates, light guide plates, etc., which are widely used in display devices, optical instruments, laser systems and other fields) is a key link to ensure their optical performance, structural adaptability and reliability in use. Its main purposes are as follows:
I. Ensuring contour accuracy and guaranteeing structural and functional adaptation The contour of an optical plate (such as size, flatness, curvature, edge angle, etc.) directly affects its assembly accuracy and functional realization in the equipment:
– Structural adaptability: In precision optical systems (such as lens modules, projector optical paths), the contour dimensions of the optical plate must strictly match other components. If the contour deviation is too large (such as uneven thickness, uneven edges), it will lead to excessive assembly gaps, optical path deviation, and even failure to install normally.
– Stability of optical performance: The contour design of some optical plates (such as light guide plates, prisms) directly determines the refraction and reflection paths of light. Insufficient contour accuracy will cause optical path disorders (such as uneven brightness of display devices, blurred imaging of optical instruments). Detecting the contour can ensure that it meets the optical design parameters.
– Guarantee of mechanical strength: Contour defects (such as edge chipping, sudden thickness changes) may lead to stress concentration, reduce the impact resistance of the optical plate, and make it easy to break in subsequent processing or use (such as being affected by vibration, temperature changes), affecting the service life of the equipment.
II. Meeting the stringent requirements of high-end fields In high-end application scenarios (such as semiconductor lithography, aerospace optical systems, and medical precision instruments), the tolerance for contour accuracy and defects of optical plates is extremely low (even requiring “nanoscale” errors and zero visible defects). The purpose of detection is more focused on:
– Ensuring the ultimate performance of optical systems (for example, the contour error of optical plates in lithography machines must be controlled at the micrometer level; otherwise, it will directly affect the precision of chip manufacturing processes).
– Guaranteeing the long-term stability of equipment (such as optical plates in satellite optical lenses; tiny defects may gradually expand in the space environment due to radiation and temperature differences, leading to mission failure).
In summary, the detection of contours and defects in optical plates essentially involves dual control of “structural precision” and “optical purity.” It ensures that optical plates can not only fit accurately and function efficiently in optical systems but also maintain stability and safety during long-term use. This is particularly crucial for determining the performance and reliability of equipment in high-end fields.
Testing Requirements
According to the test requirements provided by the customer, the surface contour of the optical plate is scanned using line spectral technology to analyze the contour data, obtain the depth and width of grooves, and detect surface defects.
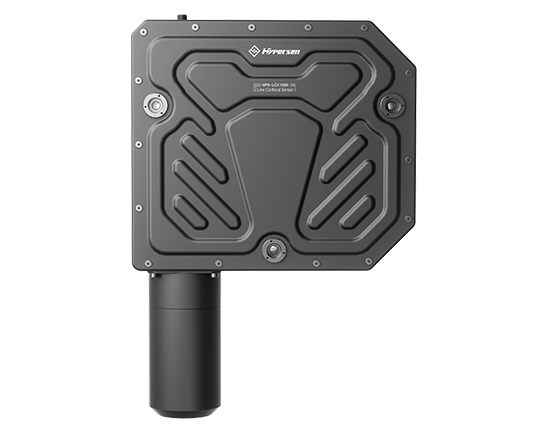
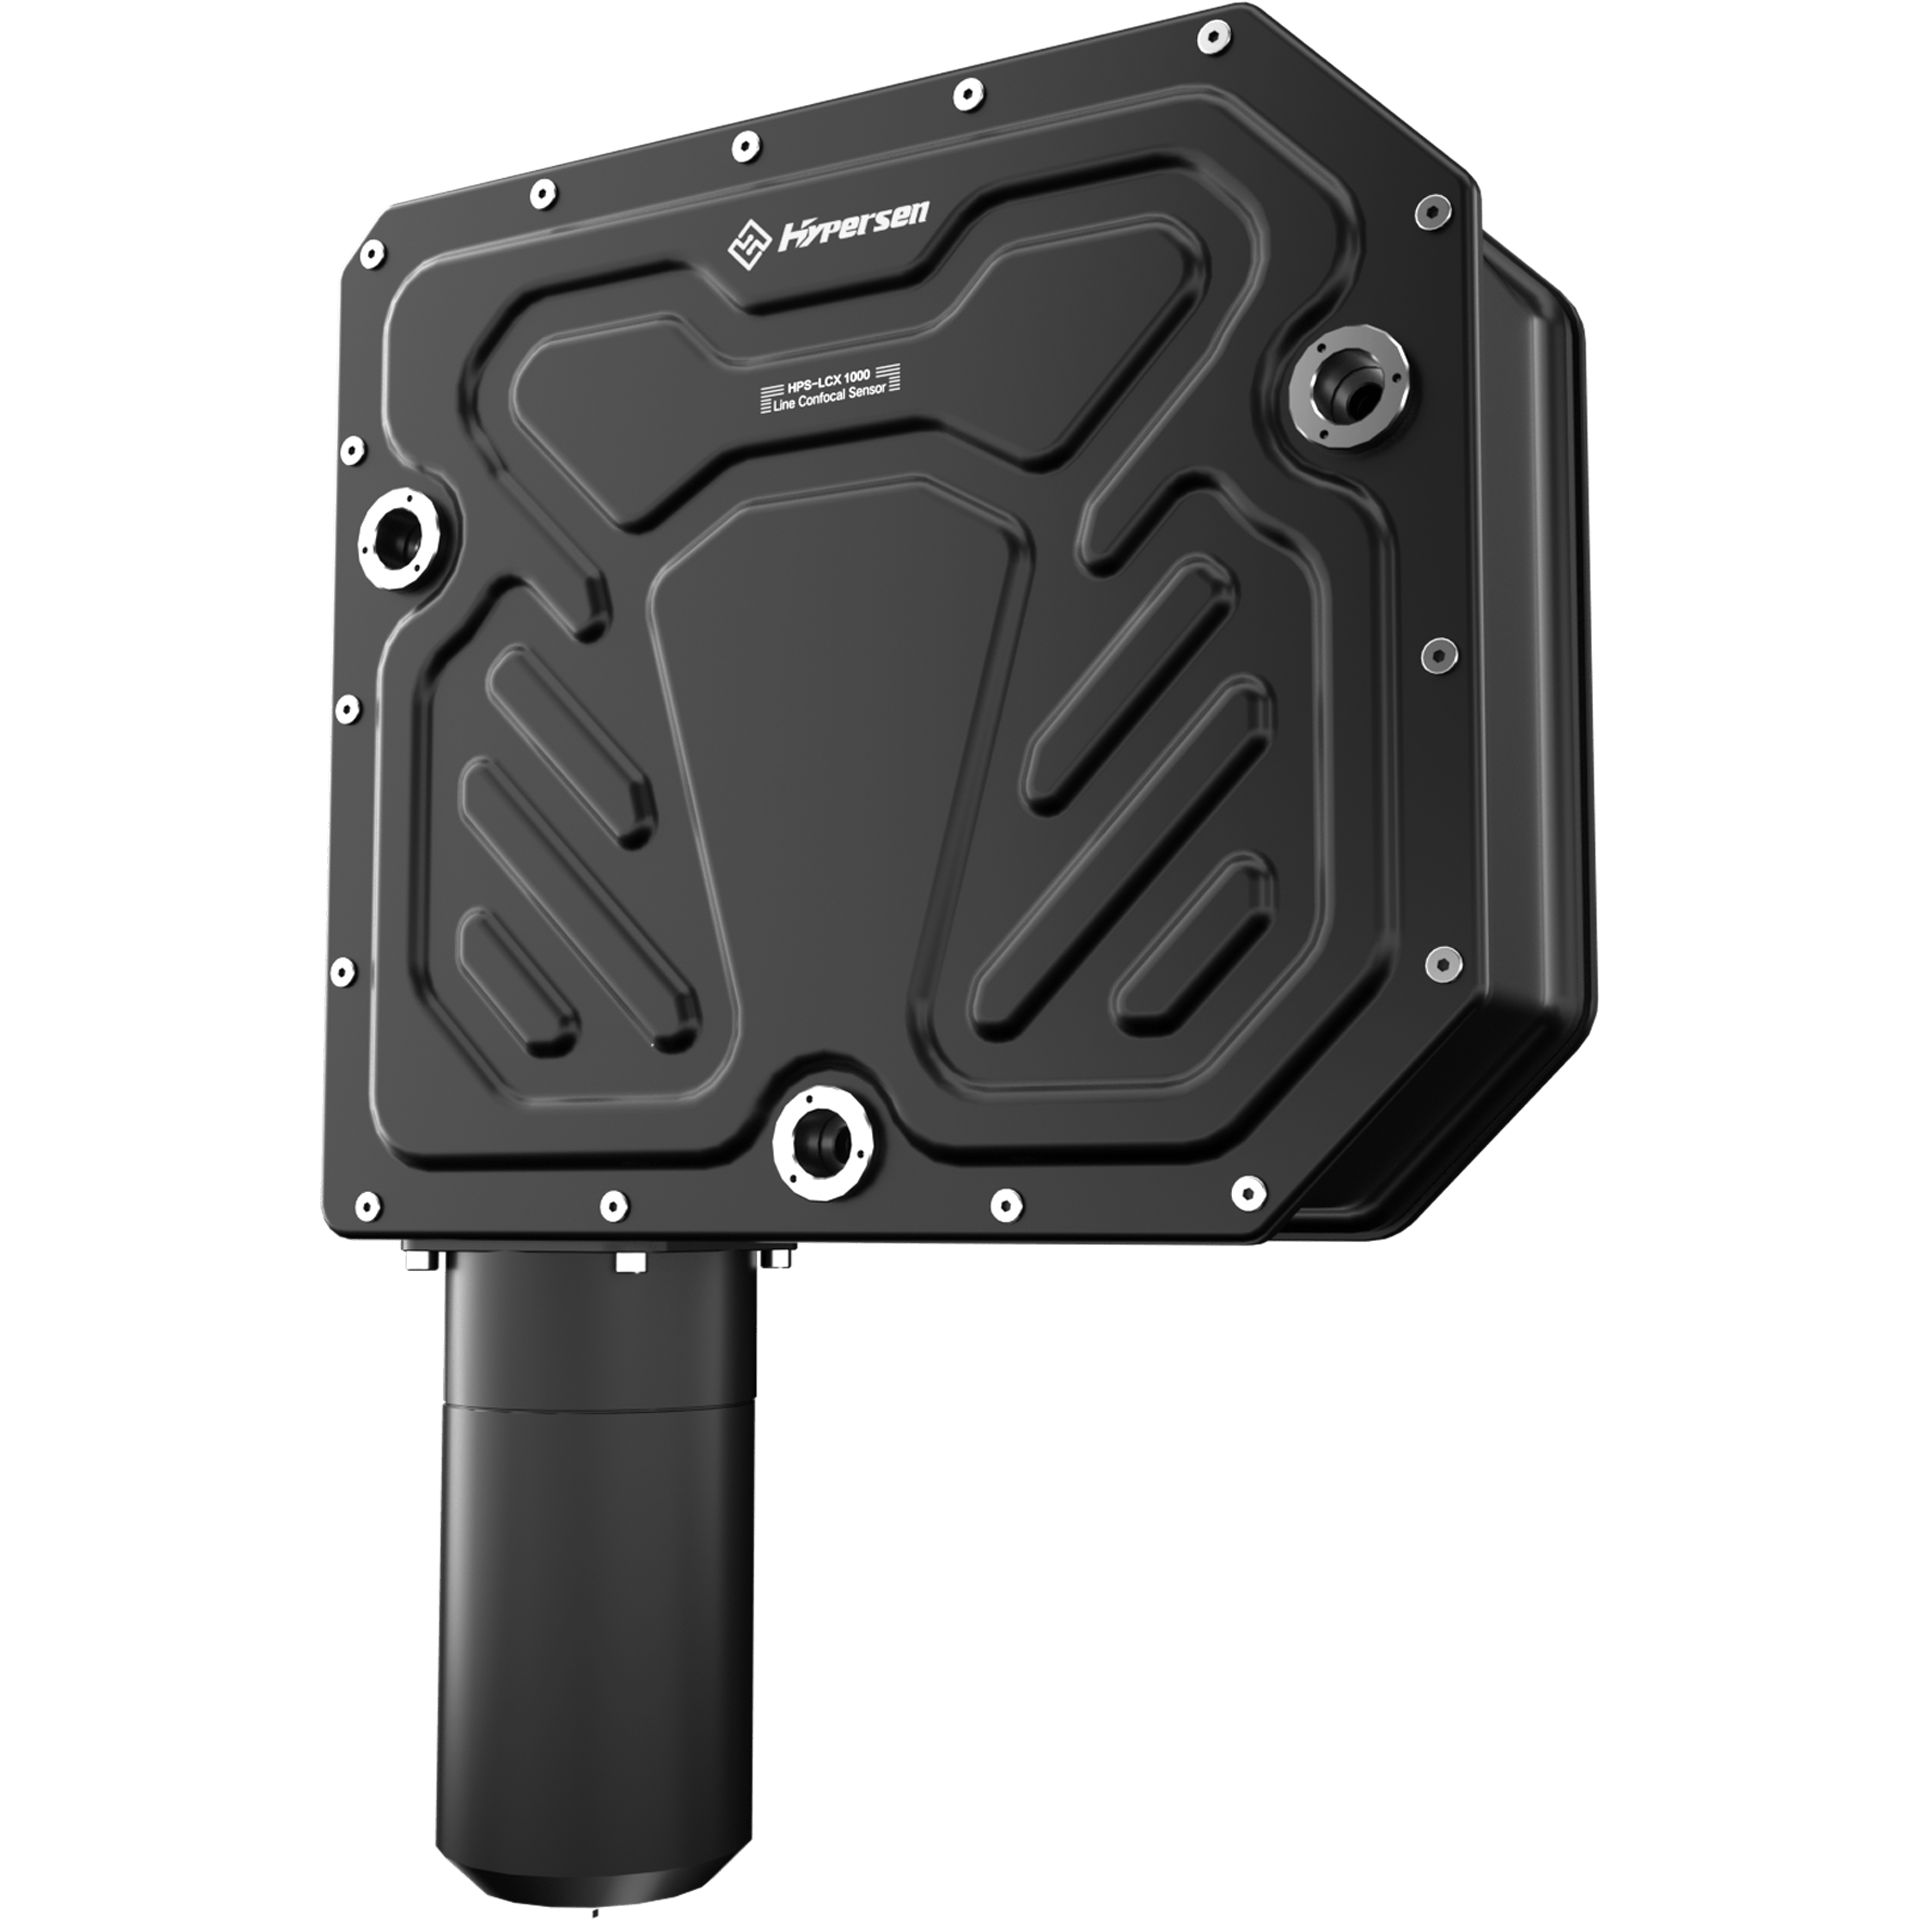
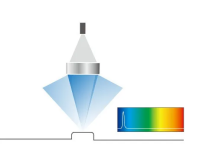
Selection and Principle
Detection images
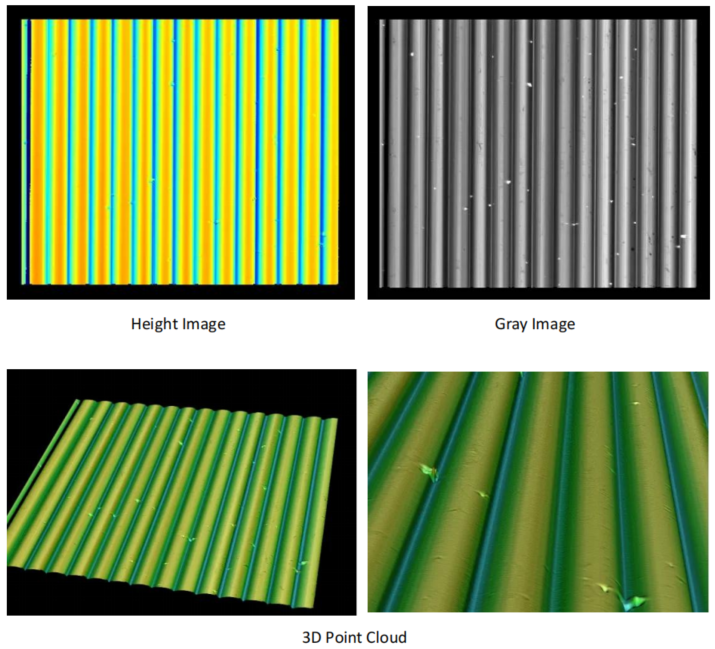
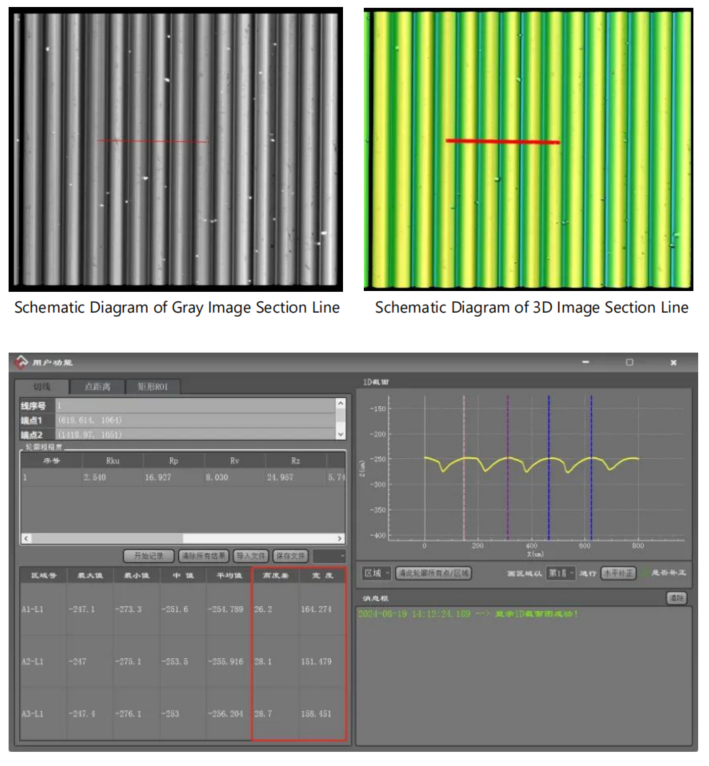
Groove detection: Capture the contour on the tested grayscale image for data calculation
Three grooves were selected for depth and width calculation, and the data are as follows:
Groove 1 has a depth of 26.2 μm and a width of 164.4 μm
Groove 2 has a depth of 28.1 μm and a width of 151.4 μm
Groove 3 has a depth of 28.7 μm and a width of 158.4 μm
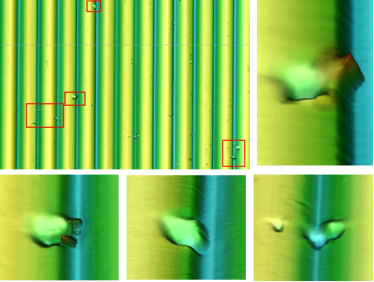
Defect Detection Effect Example
Detection Conclusion
Scanning the upper surface image of the optical plate with the LCX1000 allows for clear acquisition of groove contours. The depth and width of the grooves can be simply calculated by manually selecting regions on our client software (it should be noted that the width data may lack strict standardization, as the definition of the manually selected area for width measurement is not fully standardized). The curvature of the grooves can be processed and calculated using other vision software. Meanwhile, defects on the optical plate are clearly visible, so the system is also capable of detecting such defects.